Kandae's Algorithm, Geometrically
We give a simple graphical interpretaion to Kandae's solution to the maximum subarray problem.
1 June 2025
Recall the goal of the maximum subarray problem is given an integer array , find a subarray such that the sum of the entries is maximized among all subarrays of . Kandae's solution is, roughly speaking, greedily maximize wrt no non-positive prefixes. We provide a graphical interpretation of this explanation.
We interpret as narrating the movement along a path starting at an arbitrary initial position. From this, we graph out the current position. In other words, we interpret a positive/negative integer as moving right/left from our current position by units. Maximizing subarray sum is equivalent to maximizing the displacement along this path.
For example, suppose . Assuming our initial position is at , then the plot associated to is given by the picture below.
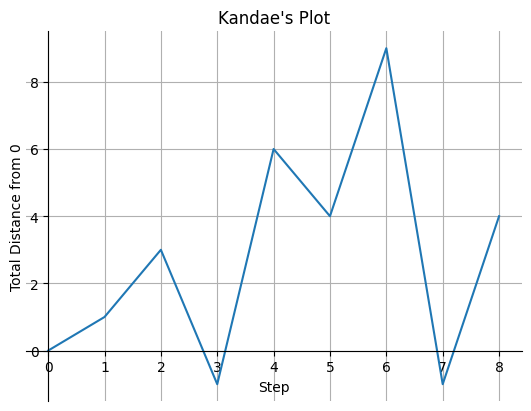
Plot associated to [1,2,-4,7,-2,5,-10,5].
Notice that there are two non-positive prefixes, namely the subarrays and . In the plot, these would constitutes as "restarts", since they take down to or below the previous minimum. Between each "restart" we can just obviously employ a simple greedy scheme of keeping max displacement.
An alterantive interpretation is to interpret the above plot as the price action chart of a stock. Under this interpretation, we see that this problem becomes best time to buy and sell stock.